About
A plot of the sample autocorrelation against the lag . It is a key tool for identifying the structure of a time series process.
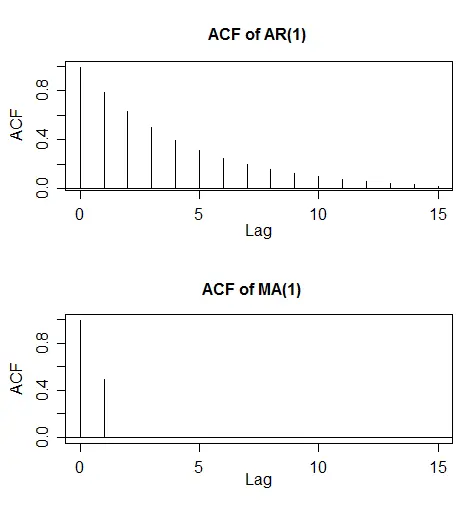
Identifying MA vs AR using Correlogram
Key difference for model identification:
- MA: Cuts off cleanly at lag
- AR: Decays exponentially