- From: Tugas Kelompok 3.pdf
Question
Penelitian psikologi mencatat kemampuan 25 mahasiswa untuk berkonsentrasi pada pembelajaran online melalui Zoom meeting.
Variabel yang diamati adalah waktu (dalam jam) dari awal belajar sampai kehilangan konsentrasi.
Tanda + menunjukkan data tersensor (mahasiswa belum kehilangan konsentrasi saat pengamatan berakhir).
Data (disortir berdasarkan waktu):
| No | Waktu (jam) | Tersensor |
|---|---|---|
| 1 | 0.1 | |
| 2 | 0.2 | |
| 3 | 0.2 | |
| 4 | 0.3 | |
| 5 | 0.3 | |
| 6 | 0.3 | |
| 7 | 0.4 | |
| 8 | 0.7 | |
| 9 | 0.8 | |
| 10 | 0.9 | + |
| 11 | 1.0 | |
| 12 | 1.0 | |
| 13 | 1.0 | + |
| 14 | 1.1 | |
| 15 | 1.3 | |
| 16 | 1.6 | |
| 17 | 1.6 | |
| 18 | 1.8 | |
| 19 | 2.0 | + |
| 20 | 2.0 | + |
| 21 | 2.0 | + |
| 22 | 2.0 | + |
| 23 | 2.0 | + |
| 24 | 2.0 | + |
| 25 | 2.0 | + |
Total: 25 mahasiswa, 9 tersensor, 16 event (kehilangan konsentrasi)
- a. Tentukan taksiran untuk fungsi survival berdasarkan metode Kaplan-Meier, kemudian plot grafiknya.
- b. Hitunglah juga taksiran variansinya dan standar errornya.
Answer
a.
Survival function at time can be estimated with Kaplan-Meier Estimator using:
where:
- : Estimated survival time at time
- : Event occuring at time
- : Event remaining at time
Let
- : Censored data at time
Applying this estimator to the data:
| 0.1 | 1 | 0 | 25 | 24/25 | 0.96 |
| 0.2 | 2 | 0 | 24 | 22/24 | 0.88 |
| 0.3 | 3 | 0 | 22 | 19/22 | 0.76 |
| 0.4 | 1 | 0 | 19 | 18/19 | 0.72 |
| 0.7 | 1 | 0 | 18 | 17/18 | 0.68 |
| 0.8 | 1 | 0 | 17 | 16/17 | 0.64 |
| 0.9 | 0 | 1 | 16 | 1 | 0.64 |
| 1.0 | 2 | 1 | 15 | 13/15 | 0.55 |
| 1.1 | 1 | 0 | 12 | 11/12 | 0.51 |
| 1.3 | 1 | 0 | 11 | 10/11 | 0.46 |
| 1.6 | 2 | 0 | 10 | 8/10 | 0.37 |
| 1.8 | 1 | 0 | 8 | 7/8 | 0.32 |
| 2.0 | 0 | 7 | 7 | 1 | 0.32 |
We get:
| Interval | |
|---|---|
| 0.1 | 1.0 |
| 0.1 0.2 | 0.96 |
| 0.2 0.3 | 0.88 |
| 0.3 0.4 | 0.76 |
| 0.4 0.7 | 0.72 |
| 0.7 0.8 | 0.68 |
| 0.8 0.9 | 0.64 |
| 0.9 1.0 | 0.64 |
| 1.0 1.1 | 0.55 |
| 1.1 1.3 | 0.51 |
| 1.3 1.6 | 0.46 |
| 1.6 1.8 | 0.37 |
| 1.8 2.0 | 0.32 |
| 2.0 | 0.32 |
Plotting using Python:
import seaborn

seaborn.lineplot(
    ests, x="Interval", y="Estimated Survival Time",
    drawstyle="steps-post", marker='o'
).figure.savefig("/home/fazuh/Notes/assets/1774435528.png")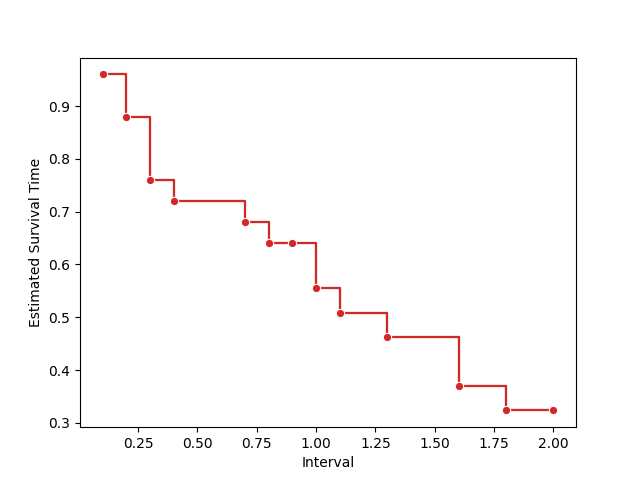
b.
The variance and standard error of the estimated survival function can also be estimated using Greenwood’s Formula:
Continuing from point a.,
Let
Then the estimated variance and standard error for the estimated survival function are:
| 0.1 | 1 | 25 | 0.9600 | 0.0017 | 0.0017 | 0.9216 | 0.0015 | 0.0392 |
| 0.2 | 2 | 24 | 0.8800 | 0.0038 | 0.0055 | 0.7744 | 0.0042 | 0.0650 |
| 0.3 | 3 | 22 | 0.7600 | 0.0072 | 0.0126 | 0.5776 | 0.0073 | 0.0854 |
| 0.4 | 1 | 19 | 0.7200 | 0.0029 | 0.0156 | 0.5184 | 0.0081 | 0.0898 |
| 0.7 | 1 | 18 | 0.6800 | 0.0033 | 0.0188 | 0.4624 | 0.0087 | 0.0933 |
| 0.8 | 1 | 17 | 0.6400 | 0.0037 | 0.0225 | 0.4096 | 0.0092 | 0.0960 |
| 0.9 | 0 | 16 | 0.6400 | 0.0000 | 0.0225 | 0.4096 | 0.0092 | 0.0960 |
| 1.0 | 2 | 15 | 0.5547 | 0.0103 | 0.0328 | 0.3077 | 0.0101 | 0.1004 |
| 1.1 | 1 | 12 | 0.5084 | 0.0076 | 0.0403 | 0.2585 | 0.0104 | 0.1021 |
| 1.3 | 1 | 11 | 0.4622 | 0.0091 | 0.0494 | 0.2136 | 0.0106 | 0.1028 |
| 1.6 | 2 | 10 | 0.3698 | 0.0250 | 0.0744 | 0.1367 | 0.0102 | 0.1009 |
| 1.8 | 1 | 8 | 0.3236 | 0.0179 | 0.0923 | 0.1047 | 0.0097 | 0.0983 |
| 2.0 | 0 | 7 | 0.3236 | 0.0000 | 0.0923 | 0.1047 | 0.0097 | 0.0983 |
Appendix
Python version
from itertools import groupby

data: list[tuple[float, bool]] = [ (1.8, False), (2.0, True), (1.0, True), (2.0, True), (1.6, False), (0.7, False), (0.9, True), (1.6, False), (0.2, False), (0.4, False), (2.0, True), (2.0, True), (2.0, True), (1.0, False), (1.1, False), (0.3, False), (0.1, False), (0.3, False), (0.3, False), (2.0, True), (1.0, False), (1.3, False), (0.8, False), (0.2, False), (2.0, True) ]

def kaplan_meier(subjects: list[tuple[float, bool]]) -> dict[str, list[float]]:
    subjects_sorted = sorted(subjects, key=lambda x: x[0])
    remaining = len(subjects_sorted)
    prev = 1.0
    ests: dict[str, list[float]] = {
        "Interval": [],
        "Estimated Survival Time": []
    }

    for t, group in groupby(subjects_sorted, key=lambda x: x[0]):
        group = list(group)
        d = sum(1 for (_, censored) in group if not censored)

        s_t = prev * (1 - d / remaining)
        ests["Interval"].append(t)
        ests["Estimated Survival Time"].append(s_t)
        prev = s_t
        remaining -= len(group)

    return ests

ests = kaplan_meier(data)

print("| Interval | Estimated | \n| --- | --- |")
for i, (t, est) in enumerate(zip(ests["Interval"], ests["Estimated Survival Time"])):
    prev_est = 1.0 if i == 0 else ests["Estimated Survival Time"][i-1]
    prev_est = round(prev_est, 2)
    if i == 0:
        print(f"| $t <$ {t} | {prev_est:.2f} |")
    else:
        print(f"| {ests['Interval'][i-1]} $\\leq t <$ {t} | {prev_est:.2f} |")
# last row: t >= last event time
print(f"| $t \\geq$ {ests['Interval'][-1]} | {round(ests["Estimated Survival Time"][-1], 2):.2f} |")
Data: Original ordering
| No | Waktu (jam) | Tersensor |
|---|---|---|
| 1 | 1.8 | |
| 2 | 2.0 | + |
| 3 | 1.0 | + |
| 4 | 2.0 | + |
| 5 | 1.6 | |
| 6 | 0.7 | |
| 7 | 0.9 | + |
| 8 | 1.6 | |
| 9 | 0.2 | |
| 10 | 0.4 | |
| 11 | 2.0 | + |
| 12 | 2.0 | + |
| 13 | 2.0 | + |
| 14 | 1.0 | |
| 15 | 1.1 | |
| 16 | 0.3 | |
| 17 | 0.1 | |
| 18 | 0.3 | |
| 19 | 0.3 | |
| 20 | 2.0 | + |
| 21 | 1.0 | |
| 22 | 1.3 | |
| 23 | 0.8 | |
| 24 | 0.2 | |
| 25 | 2.0 | + |